Financial statements are a crucial tool for businesses and investors alike. They provide a snapshot of a company's financial health and performance over a period of time. However, simply looking at the raw numbers does not always provide a clear understanding of how a company is performing. This is where common-size financial statements come in. By expressing financial statement data as a percentage of a common base, these statements allow for a more meaningful comparison and analysis.
Common size financial statements are particularly useful when analyzing the income statement and balance sheet. On the income statement, each line item is expressed as a percentage of the total revenue. This allows for a comparison of the different components of the income statement and helps identify trends and patterns. Similarly, on the balance sheet, each line item is expressed as a percentage of the total assets or liabilities, providing insights into the company's financial structure and its ability to meet its obligations.
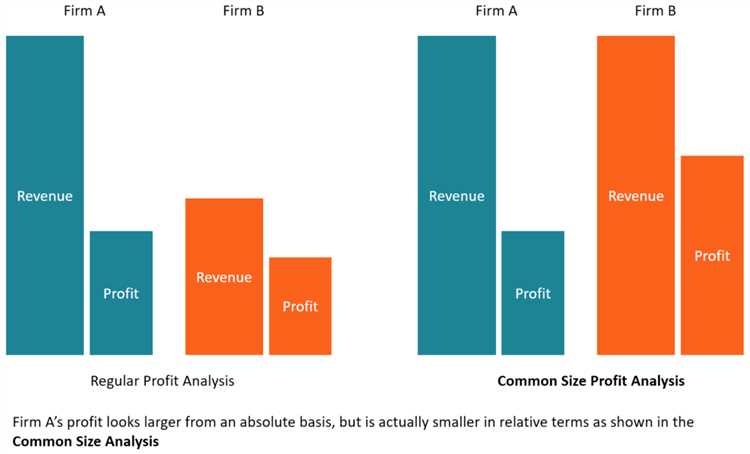
One of the key advantages of common size financial statements is the ability to compare the performance of a company across different years. By expressing the financial data as a percentage, the impact of the company's growth or decline in size can be eliminated, allowing for a more accurate analysis of its financial trends. Additionally, common size statements can also be used to compare a company's performance to industry benchmarks and identify areas where it may be overperforming or underperforming.
In addition to the income statement and balance sheet, common size financial statements can also be applied to financial ratios. By expressing the different ratios as a percentage, it becomes easier to compare a company's performance to industry standards or to its own historical performance. This can help identify areas where the company may be over or underperforming and guide decision-making.
In conclusion, common size financial statements are a powerful tool for analyzing a company's financial performance. By expressing financial statement data as a percentage of a common base, these statements allow for a more meaningful comparison and analysis of a company's financial health and trends. Whether comparing different components of an income statement, analyzing the structure of a balance sheet, or evaluating financial ratios, common size financial statements provide valuable insights that can inform decision-making and drive business success.
What Are Common Size Financial Statements?
Common size financial statements are a useful tool for comparison and analysis of financial data. They present financial statements in a standardized format, where each item is expressed as a percentage of a common base. This allows for easy comparison between years and among companies in the same industry.
Common size financial statements are created by converting the dollar amounts in a company's balance sheet and income statement into percentages. For example, in a common size balance sheet, each asset and liability is expressed as a percentage of total assets, and in a common size income statement, each line item is expressed as a percentage of total revenue.
The main purpose of common size financial statements is to highlight trends and identify areas of strength or weakness within a company. By analyzing the ratios and percentages, analysts can identify areas where a company may be underperforming compared to industry benchmarks. This can help in making informed decisions and strategies to improve financial performance.
Common size financial statements also allow for easy comparison of financial data over multiple years. By analyzing the trend of percentages over time, analysts can identify patterns or changes that may indicate shifts in a company's financial health or performance.
Overall, common size financial statements provide a standardized way to analyze and interpret financial data. They help to identify trends, benchmark against industry standards, and make informed decisions based on the analysis of ratios and percentages.
Definition of Common Size Financial Statements
A common size financial statement is a type of financial statement analysis that allows analysts and investors to easily analyze and compare the financial performance of different companies or the same company over multiple years. A common size financial statement expresses the information from the financial statement in terms of percentages, allowing for a clearer understanding of the financial trends and ratios.
Common size financial statements can be prepared for various types of financial statements, such as the balance sheet and the income statement. The percentages are calculated by dividing each line item on the financial statement by a common base, such as total assets for the balance sheet or total revenue for the income statement.
One of the key benefits of common size financial statements is that they allow for easy comparison between companies in the same industry. By converting the financial information into percentages, analysts and investors can identify and compare the financial performance and trends of different companies in a standardized way. This allows for a more effective benchmark analysis, helping to identify the strengths and weaknesses of each company and make informed investment decisions.
Common size financial statements can also be used to analyze the trends within a single company over multiple years. By comparing the percentages from year to year, analysts and investors can identify the changes in the financial performance and determine whether these changes are positive or negative. This trend analysis can provide valuable insights into the company's financial health and future prospects.
In summary, common size financial statements provide a valuable tool for the analysis of financial information. By expressing the financial data in terms of percentages, analysts and investors can easily compare companies and identify trends. Whether used for industry comparison or trend analysis, common size financial statements are an essential component of comprehensive financial analysis.
Benefits of Common Size Financial Statements
Benchmarking: Common size financial statements allow businesses to benchmark their financial performance against industry averages or competitors. By converting the financial statement figures into percentages, it becomes easier to compare and identify areas where the company may be overperforming or underperforming compared to its peers.
Trend Analysis: Common size financial statements provide a useful tool for trend analysis. By comparing the percentage changes in key line items year over year, businesses can identify whether certain assets or liabilities are growing or declining in size. This helps management make informed decisions about resource allocation and investment strategies.
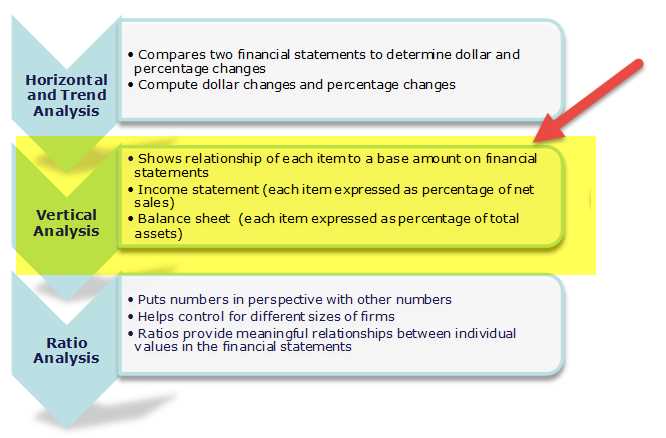
Ratio Analysis: Common size financial statements facilitate ratio analysis by enabling the calculation of various financial ratios. Ratios such as the current ratio, debt-to-equity ratio, and gross profit margin can be easily derived from the common size balance sheet and income statement. These ratios provide insights into the company's liquidity, solvency, and profitability.
Comparison: Common size financial statements allow for easy comparison of financial data across different periods. By presenting the information in a standardized format, businesses can quickly analyze changes in the financial statement figures over time. This makes it easier to identify trends, patterns, and anomalies that may require further investigation.
Understanding Financial Performance: Common size financial statements enhance the understanding of a company's financial performance by highlighting the relative importance of each item in the financial statements. By presenting the figures as percentages of a common base, such as total assets or total revenue, stakeholders can better assess the impact of each line item on the overall financial health of the business.
Identifying Strengths and Weaknesses: Common size financial statements help identify the strengths and weaknesses of a company. By comparing the percentage breakdown of different line items, businesses can identify areas where they are strong and areas where they need improvement. This information can be used to develop strategies for allocating resources, improving operational efficiency, or addressing areas of concern.
Improved Comparability
Common size financial statements provide a standardized format for presenting financial information. By converting each item on the statement into a percentage of a common base, such as total revenue or total assets, companies from different industries or of different sizes can be compared more easily.
With common size income statements, the focus is on the percentage of each expense or revenue item in relation to total revenue. This allows for a direct comparison of the cost structure and profitability of companies within the same industry. For example, analysts can compare the percentage of cost of goods sold or operating expenses for different companies to identify any significant differences.
Similarly, common size balance sheets allow for a detailed analysis of the composition of assets and liabilities. By expressing each item as a percentage of total assets or total liabilities, analysts can identify any trends or anomalies in a company's financial position over time or in comparison to industry averages.
Financial ratios calculated from common size financial statements also enhance comparability. Ratios such as gross profit margin, operating profit margin, and return on assets can be calculated and compared across companies and industries. This allows for a more meaningful comparison of the financial performance and efficiency of different companies.
In conclusion, using common size financial statements improves the comparability of financial data across different companies and industries. It allows for a more accurate and insightful analysis of a company's financial position, performance, and efficiency. By presenting financial information in a standardized format and expressing it as a percentage of a common base, common size financial statements enable analysts to make more informed decisions and identify key trends in a company's financial statements.
Identifying Trends
When analyzing financial statements, one of the key tasks is to identify trends in the data. By examining common size financial statements, such as the common size income statement and common size balance sheet, analysts can easily compare different years and industry benchmarks.
Ratios can be used to identify trends over time. By calculating and comparing ratio values from year to year, analysts can spot any significant changes and determine whether they are positive or negative. For example, if a company's gross profit margin has consistently increased over a five-year period, it may indicate improved efficiency and profitability.
Another way to identify trends is by comparing the percentage changes of different line items on the financial statements. By examining the year-over-year changes, analysts can determine if certain areas of the business are growing or declining at a faster rate compared to others. This information can be valuable for decision-making and strategic planning.
Additionally, by comparing a company's financial data to industry benchmarks, analysts can identify any trends that may be specific to the industry. For example, if a company's inventory turnover ratio is significantly lower than the industry average, it may indicate inefficiencies in inventory management.
In conclusion, identifying trends in common size financial statements is crucial for understanding the financial health and performance of a company. By analyzing ratios, percentage changes, and comparing data to industry benchmarks, analysts can gain valuable insights and make informed decisions.
Identifying Variances
When analyzing common size financial statements, one important step is to identify variances in the data. Variances refer to the differences between the current year's financial statement and a benchmark, such as a previous year's statement or industry averages.
A common tool used to identify variances is ratio analysis. Ratios are calculated by dividing one financial data point by another. For example, a common ratio is the percentage of net income to total revenue, which gives an indication of profitability. By comparing these ratios from year to year or against industry averages, you can identify any significant changes or deviations.
Another way to identify variances is by comparing the common size statements themselves. Common size financial statements express each line item as a percentage of a base amount, such as total assets on the balance sheet or total revenue on the income statement. By comparing these percentages between different years or against industry benchmarks, you can easily spot any significant changes or trends.
When analyzing variances, it is important to consider the context and underlying factors that may have contributed to the changes. For example, a decrease in net income percentage could be due to higher expenses or lower sales. By digging deeper into the financial data and conducting further analysis, you can gain a better understanding of the reasons behind the variances.
In conclusion, identifying variances in common size financial statements is a crucial step in understanding and analyzing financial data. By utilizing ratio analysis, comparing common size statements, and considering contextual factors, you can effectively identify any significant changes or trends and gain insights into the financial performance of a company.
Components of Common Size Financial Statements
Common size financial statements are a powerful tool to analyze the financial performance of a company. They allow us to compare its financial performance to industry benchmarks and track changes over the years. Common size financial statements present financial data in relation to a common base, usually expressed as a percentage.
The two most commonly used common size financial statements are the common size income statement and the common size balance sheet. The common size income statement shows the percentage of each income statement item to net sales. It helps us understand the revenue and expense structure of the company, identify trends, and make year-on-year comparisons.
On the other hand, the common size balance sheet presents each balance sheet item as a percentage of total assets. It allows us to examine the company's asset composition, leverage ratios, and financial health. By comparing the common size balance sheet of different companies in the industry, we can identify differences in their capital structure and investment strategies.
When conducting a common size financial statement analysis, it is crucial to compare the company's ratios with industry benchmarks. This allows us to assess its performance relative to its peers and gain insights into its competitive position. By comparing the percentage changes in each ratio over time, we can identify trends, strengths, and weaknesses in the company's financial performance.
In summary, common size financial statements provide a comprehensive view of a company's financial performance. They allow us to analyze its income and balance sheet data in relation to a common base. By comparing these statements with industry benchmarks and analyzing trends over time, we can gain valuable insights into the company's financial health and make informed decisions.
Income Statement
The income statement is one of the main financial statements used by businesses to analyze their financial performance. It provides an overview of a company's revenues, expenses, and net income over a specific period, typically one year. The income statement is also known as the statement of operations or profit and loss statement.
The income statement presents financial data in a common size format, where each line item is expressed as a percentage of total revenues. This allows for easy comparison and trend analysis, as it eliminates the effect of the size of the business. By calculating ratios and percentages, analysts can evaluate the profitability, efficiency, and sustainability of a company's operations.
One common ratio used in income statement analysis is the gross margin ratio, which measures the percentage of revenue remaining after deducting the cost of goods sold. This ratio is used to assess a company's pricing strategy and its ability to control production costs. Another important ratio is the operating margin ratio, which indicates the profitability of a company's core operations by measuring the percentage of revenue left after deducting operating expenses.
When analyzing an income statement, it is essential to benchmark the company's performance against industry standards and competitors. This allows for a more meaningful comparison and helps identify areas of strength and weakness. By tracking the income statement over several years, analysts can also identify trends and evaluate the company's financial health and stability.
The income statement is closely linked to the balance sheet, as the net income reported on the income statement is carried over to the balance sheet as retained earnings. This indicates the amount of profit reinvested in the business. The income statement provides valuable insights into a company's financial performance and is a crucial tool for investors, lenders, and other stakeholders seeking to understand its profitability and sustainability.
Balance Sheet
The balance sheet is a financial statement that provides a snapshot of a company's financial position at a given point in time. It presents the company's assets, liabilities, and shareholders' equity, and is used for analyzing the financial health and stability of a company. By comparing the data from the balance sheet over multiple years, analysts can identify trends and assess the company's performance and growth.
One common way to analyze the balance sheet is through the use of ratios. These ratios, such as the current ratio and debt-to-equity ratio, provide insights into the company's liquidity, solvency, and debt levels. By comparing these ratios to industry benchmarks, analysts can evaluate how the company fares against its competitors and the industry as a whole.
Another important aspect of the balance sheet analysis is the percentage analysis. This approach involves expressing each item on the balance sheet as a percentage of the total assets or liabilities. By doing so, it allows for a better understanding of the composition and structure of the company's balance sheet. Analysts can identify any significant changes or anomalies in the balance sheet percentages and investigate the reasons behind them.
The common size balance sheet is also useful for conducting a trend analysis. By creating common size financial statements, where each line item is expressed as a percentage of the total, analysts can easily spot any persistent and significant changes in the balance sheet over time. This facilitates the identification of emerging trends and the assessment of the company's financial performance and position in the market.
In conclusion, the balance sheet is a fundamental financial statement that provides valuable information for analyzing a company's financial health and stability. Through the use of ratios, percentage analysis, and trend analysis, analysts can gain insights into the company's liquidity, solvency, and overall performance. This analysis is crucial for making informed investment decisions and understanding the financial position of a company within its industry.
Cash Flow Statement
The cash flow statement is a financial statement that shows the trends in cash flow for a specific period of time. It provides a snapshot of how cash is generated and used by a company. By analyzing the cash flow statement, investors and analysts can gain insights into a company's liquidity, operating activities, and financing activities.
Percentage analysis is commonly used to analyze the cash flow statement. It involves expressing each line item of the statement as a percentage of the total cash flow from operating activities. This allows for easy comparison of the different components and helps identify areas of strength or weakness.
Ratios can also be derived from the cash flow statement. One commonly used ratio is the cash flow to sales ratio, which measures how much cash is generated from each dollar of sales. This ratio can be compared to industry benchmarks to assess a company's efficiency in generating cash.
The cash flow statement can be analyzed in conjunction with other financial statements, such as the balance sheet and income statement, to get a comprehensive understanding of a company's financial health. By comparing the trends in cash flow over multiple years, analysts can identify any significant changes or anomalies that may require further investigation.
Overall, the cash flow statement provides valuable insights into a company's cash generation and utilization. It helps investors and analysts make informed decisions by providing data on a company's ability to generate cash, its liquidity position, and its ability to meet its financial obligations. By analyzing the cash flow statement, investors can gain a better understanding of a company's financial performance and make more accurate predictions about its future prospects.
How to Prepare Common Size Financial Statements
Preparing common size financial statements is a valuable tool for analyzing a company's financial performance and comparing it to industry benchmarks. These statements allow you to evaluate the company's financial health, identify trends, and make informed decisions.
To begin, gather the necessary financial data, including the balance sheet and income statement for the relevant year. The balance sheet provides information about the company's assets, liabilities, and equity, while the income statement shows its revenue, expenses, and net income.
Next, convert the financial data into percentages by dividing each line item by a relevant base amount. The base amount is typically total assets for the balance sheet and total revenue for the income statement. This process creates a common size financial statement that highlights the proportion of each line item relative to the base.
Analyze the common size financial statements by comparing the percentages over multiple years to identify any trends or fluctuations. This analysis can reveal whether a particular line item has been consistently growing or declining, indicating the company's financial performance.
Additionally, you can compare the company's common size financial statements to industry benchmarks to gauge its performance against competitors. Industry data can provide valuable insights into the company's strengths and weaknesses in relation to its peers.
Furthermore, the common size financial statements allow for ratio analysis. Ratios, such as the debt-to-equity ratio or the gross profit margin, can be calculated using the data from the common size financial statements. These ratios can further enhance your understanding of the company's financial health and performance.
In conclusion, preparing common size financial statements is a crucial step in financial analysis. These statements provide a clear picture of a company's financial performance, highlight trends, and enable meaningful comparisons with industry benchmarks. By utilizing the percentage data and conducting ratio analysis, you can gain valuable insights to make informed decisions for your business.
Step 1: Gather the Financial Statements
Before you can begin analyzing financial statements, you need to gather the necessary data. The first step is to obtain the financial statements for the year you want to analyze. These statements typically include the balance sheet, income statement, and cash flow statement.
Start by locating the annual report or 10-K filing of the company you are interested in. This report will contain all the financial statements required for your analysis. If you are comparing multiple companies within the same industry, gather the financial statements for each company.
Make sure that the financial statements you gather are from the same year to ensure accurate and consistent analysis. It's also important to note that you should use the common size financial statements, which present each line item as a percentage of the total. This allows for easier comparison between companies of different sizes or within the same company over different years.
Once you have gathered the necessary financial statements, organize them in a logical manner. You can create a spreadsheet or use a financial analysis software to input the data and calculate the percentage values for each line item. This will make it easier to perform the common size financial statement analysis and identify any trends or differences.
By gathering the financial statements and preparing them for analysis, you are taking the first step towards understanding the company's financial position, performance, and potential areas of improvement. The data you have collected will serve as a benchmark for future comparison and provide valuable insights into the company's financial health.
Step 2: Calculate Percentages
Once you have gathered the necessary data from the common size financial statements, the next step is to calculate percentages. This involves converting the numbers on the balance sheet and income statement into ratios or percentages, making it easier to compare them.
Start by selecting a base year for comparison. This could be the most recent year or a year that you want to benchmark against. Then, take each line item on the balance sheet or income statement and divide it by the total assets (for balance sheet items) or total revenue (for income statement items) for that year. Multiply this result by 100 to get the percentage.
Once you have calculated the percentages for each line item, you can analyze the trends and make comparisons between different years. This can help you identify areas of improvement or areas where your company is performing well. You can also compare your ratios to industry benchmarks to see how your company stacks up against its peers.
Percentage analysis is a powerful tool that allows you to quickly and easily understand the financial health of your company. By converting the numbers on the balance sheet and income statement into percentages, you can easily identify trends and make informed decisions about your business. Whether you are a small business owner or a financial analyst, understanding common size financial statements and performing percentage analysis is essential for making strategic financial decisions.
Step 3: Create the Common Size Financial Statements
In order to conduct a comprehensive analysis of a company's financial performance, it is essential to create common size financial statements. These statements present financial data in the form of percentages, allowing for easier comparison and trend analysis.
To create common size financial statements, you need to calculate various ratios and percentages. Start with the income statement and calculate each line item as a percentage of total revenue. This will help you understand the proportion of each expense or revenue category in relation to the overall income of the company.
Next, move on to the balance sheet and calculate each asset and liability as a percentage of total assets or total liabilities, respectively. This will provide insights into the composition of the company's balance sheet and highlight any significant trends or variations over time.
It is important to note that common size financial statements should not be analyzed in isolation. They should be used in conjunction with industry benchmarks and historical data to gain a more comprehensive understanding of a company's financial performance.
By comparing a company's common size financial statements to industry averages or benchmarks, you can identify areas of strength or weakness. For example, if a company's percentage of marketing expenses is significantly higher than the industry average, it may indicate that the company is overspending in this area.
Overall, creating common size financial statements is a crucial step in financial analysis. It allows for a more detailed examination of a company's financial data and enables meaningful comparisons over time and with industry standards.
Interpreting Common Size Financial Statements
When analyzing financial statements, it is essential to understand common size financial statements. These statements are useful tools for interpreting and comparing financial data across different time periods or companies. Common size financial statements present data in percentages, allowing for easy analysis and benchmarking against industry norms.
One key way to interpret common size financial statements is by analyzing the balance sheet and income statement. These statements provide a snapshot of a company's financial position and performance, respectively. By examining the common size percentages on these statements, one can identify trends and evaluate a company's financial health.
Another important aspect of interpreting common size financial statements is comparing ratios and percentages. Ratios such as the debt-to-equity ratio or the current ratio can provide insights into a company's liquidity and financial stability. By comparing these ratios over time or to industry averages, analysts can evaluate a company's performance and identify potential areas of concern.
Moreover, common size financial statements allow for trend analysis. By observing the changes in percentage values from year to year, one can identify patterns and assess a company's financial trajectory. For example, if a company's cost of goods sold as a percentage of sales has been steadily increasing, it may indicate inefficiencies or higher production costs.
Lastly, interpreting common size financial statements involves understanding the industry in which a company operates. Different industries have varying norms and benchmarks, so it is crucial to compare common size percentages to industry standards. This analysis can help identify areas where a company is underperforming or outperforming its peers.
In conclusion, common size financial statements provide valuable insights into a company's financial performance and position. By analyzing the balance sheet, income statement, ratios, trends, and comparing to industry benchmarks, analysts can interpret and evaluate a company's financial health effectively. Understanding common size financial statements is an essential skill for investors, lenders, and other stakeholders in making informed decisions.
Industry Comparisons
When analyzing common size financial statements, industry comparisons play a crucial role in understanding the performance of a company. By examining the common size data of different companies within the same industry, analysts can identify trends, benchmarks, and areas for improvement.
One common way to compare companies within an industry is by analyzing their common size income statements. This involves examining the percentage breakdown of various expenses such as cost of goods sold, operating expenses, and net income. By comparing these percentages across multiple companies, analysts can determine which companies are more efficient in managing their expenses.
Another aspect of industry comparisons is analyzing common size balance sheets. This involves examining the percentage breakdown of a company's assets, liabilities, and equity. By comparing these percentages across multiple companies, analysts can determine which companies have a stronger financial position and are better able to weather economic downturns.
Ratio analysis is also a valuable tool for industry comparisons. By calculating various financial ratios such as liquidity ratios, profitability ratios, and efficiency ratios, analysts can compare a company's performance to industry averages. This helps identify areas where a company may be falling behind or excelling in comparison to its peers.
Industry comparisons are essential for understanding a company's performance and identifying areas for improvement. By analyzing common size financial statements, conducting ratio analysis, and benchmarking against industry averages, analysts can gain valuable insights into a company's financial health and performance trends over time.
Trend Analysis
In financial statement analysis, trend analysis is a powerful tool for understanding a company's performance over time. It involves the comparison and analysis of financial data to identify patterns or trends that can help determine the company's financial health and provide insights for future decision-making.
One common way to perform trend analysis is through the use of percentage or common size financial statements. These statements represent financial data as a percentage of a benchmark, typically using the total revenue for the income statement and total assets for the balance sheet. This allows for easy comparison of different periods and helps identify trends in the company's financial performance.
Trend analysis can be applied to various financial statement ratios, such as profitability ratios, liquidity ratios, and solvency ratios. By analyzing these ratios over time, analysts can identify if the company's performance is improving or deteriorating and compare it to industry benchmarks. This information can be used to identify areas of strength and weakness, make informed financial decisions, and set financial goals.
Furthermore, trend analysis can help identify potential risks and opportunities for a company. By analyzing the trends in the industry, analysts can identify emerging opportunities or threats and adjust their strategies accordingly. For example, if the trend analysis reveals a decline in profitability compared to industry peers, it may indicate the need for cost-cutting measures or a shift in the company's product offerings.
In summary, trend analysis is a crucial tool for understanding the financial performance of a company over time. By analyzing financial data using percentage or common size statements, comparing ratios, and benchmarking against industry standards, analysts can gain insights into the company's financial health and make informed decisions for the future.
Key Performance Indicators
Key Performance Indicators (KPIs) are commonly used ratios or metrics that allow for a detailed analysis of various aspects of a company's financial performance. These KPIs are derived from common size financial statements, which present the financial data as percentages of a common base.
The use of KPIs provides a benchmark for comparison, both internally within a company and externally to industry standards. By analyzing these ratios, businesses can identify areas of strength and weakness, and make informed decisions based on the trends revealed in the data.
Some common KPIs include the current ratio, which measures a company's ability to pay its short-term obligations; the quick ratio, which assesses a company's liquidity without considering inventory; and the debt-to-equity ratio, which determines the proportion of a company's financing that comes from debt as opposed to equity.
Furthermore, KPIs derived from the income statement, such as the gross profit margin and operating profit margin, provide insights into a company's profitability. KPIs derived from the balance sheet, such as the return on assets and return on equity, measure the effectiveness of a company's use of its assets and equity to generate profits.
Industry comparisons are also integral to KPI analysis, as they allow companies to measure their performance against their peers. This benchmarking exercise enables businesses to identify areas where they may be underperforming or outperforming their competitors, and make strategic adjustments accordingly. By regularly monitoring KPIs, companies can track their progress and make data-driven decisions for future growth and success.
Limitations of Common Size Financial Statements
Common size financial statements are a useful tool for analyzing financial data and trends, but they do have their limitations. It is important to understand these limitations to ensure accurate and meaningful analysis.
Firstly, common size financial statements only provide a percentage representation of the financial data. While this allows for easy comparison within a company or industry, it does not give a complete picture of the actual dollar amounts. For example, a company may have a high percentage of expenses in relation to its revenue, but the actual dollar amount may still be low.
Additionally, common size financial statements only compare data from a single year. This means that any trend analysis or comparison to industry benchmarks may be limited. It is important to also consider data from previous years to understand the full context and trend of a company's financial performance.
Along with this, common size financial statements typically focus on the income statement and do not provide as much detail on the balance sheet. This can limit the ability to fully analyze a company's financial health and stability. It is important to also consider ratios and other balance sheet data when analyzing a company.
Lastly, common size financial statements rely on the accuracy and completeness of the underlying financial data. If there are errors or omissions in the financial statements, the analysis may be misleading or inaccurate. Therefore, it is crucial to ensure that the financial statements used for common size analysis are reliable.
In conclusion, while common size financial statements can be a useful tool for analyzing financial data, they do have limitations. It is important to consider these limitations and use them in conjunction with other financial analysis methods to ensure a comprehensive understanding of a company's financial performance and position.
Reliance on Historical Data
Understanding common size financial statements requires a reliance on historical data. These statements provide a comprehensive view of a company's financial position and performance over a specific period of time. By analyzing the common size financial statement, one can benchmark the company's financial ratios, such as the current ratio and the debt-to-equity ratio, against industry averages or previous year's performance.
The common size financial statement expresses each item as a percentage of a specific base item, typically total assets for the balance sheet or total sales for the income statement. This analysis allows for a more accurate comparison between companies of different sizes or within the same company over multiple years.
One of the key advantages of utilizing common size financial statements and conducting ratio analysis is the ability to identify trends. By examining the trends in the financial ratios over time, financial analysts can gain insights into the company's financial health and performance. For example, if a company's total debt as a percentage of total assets has been increasing steadily over the past few years, it may indicate a higher risk of financial distress.
In addition to trend analysis, common size financial statements provide a useful tool for benchmarking. By comparing a company's financial ratios to industry averages or competitors' ratios, analysts can identify areas of strength or weakness. For example, if a company's gross profit margin is significantly lower than the industry average, it may indicate inefficiencies in the company's cost structure.
In conclusion, common size financial statements offer a comprehensive view of a company's financial position and performance. By relying on historical data and conducting ratio analysis, financial professionals can gain valuable insights into a company's financial health, identify trends, and benchmark the company's performance against industry averages or previous year's performance.
Different Accounting Methods
When analyzing financial statements, it is important to consider the different accounting methods used by companies. Different accounting methods can impact the ratios and percentages calculated for financial statement analysis, making it crucial to understand these differences in order to accurately interpret and compare data.
One key area where accounting methods differ is in the treatment of certain line items on the income statement and balance sheet. For example, some companies may choose to expense certain costs immediately, while others may capitalize them and spread them out over time. This can impact the profitability ratios and the size of certain line items on the balance sheet.
Additionally, different industries may have different accounting standards and regulations that dictate how certain transactions are recorded. This can result in variations in financial statements across industries, making it challenging to compare companies in different sectors.
It is also important to consider the impact of accounting method changes over time. Companies may change their accounting methods from year to year, which can affect the comparability of financial statements. When analyzing data over multiple years, it is important to be aware of any changes in accounting methods and adjust the analysis accordingly.
To accurately analyze financial statements and compare ratios and percentages, it is important to perform a common size analysis. This involves converting the data on the income statement and balance sheet into percentages of a common base, such as total revenue or total assets. This allows for easier comparison across companies and years, and helps to identify trends and benchmark performance.
In conclusion, understanding the different accounting methods used by companies is crucial for accurate financial statement analysis. By considering the impact of these accounting methods and performing a common size analysis, analysts can effectively analyze and compare financial data to make informed decisions.
Lack of External Factors
One of the limitations of common size financial statement analysis is the lack of consideration for external factors that may impact a company's performance. While common size financial statements provide valuable insights into a company's financial health and performance, they do not take into account industry-specific data or external economic factors that may have a significant impact on a company's operations.
Without considering external factors, such as changes in market conditions or government regulations, the analysis of common size financial statements may not provide a complete picture of a company's financial standing. For example, a company may appear to be performing well in terms of its common size income statement, but if the industry as a whole is experiencing a downturn, this positive trend may not be sustainable in the long term.
Furthermore, common size financial statements only provide a percentage breakdown of financial data, without providing any information about the actual dollar amounts. This makes it difficult to make direct comparisons between companies or track trends over time. While common size ratios can be useful for benchmarking and trend analysis within a company's own financial statements, they may not offer much value when comparing to other companies or industry standards.
To overcome the limitation of external factors in common size financial statement analysis, it is important to supplement the analysis with other forms of financial and industry-specific data. This could include conducting a comparative analysis of common size balance sheets and income statements from different years, as well as reviewing industry reports and economic indicators. By considering both internal and external factors, a more comprehensive understanding of a company's financial performance can be achieved.
References
1. Common Size Financial Statements: Common size financial statements provide a way to standardize and compare financial data across different companies or within the same company over time. By expressing financial statement items as a percentage of a common base, such as total assets or net sales, analysts can easily identify trends and benchmark performance.
2. Benchmark Analysis: Benchmark analysis involves comparing the financial performance of a company to its industry peers or competitors. Common size financial statements can be particularly useful in benchmark analysis, as they allow for a more meaningful comparison by eliminating the impact of size differences between companies.
3. Trend Analysis: Trend analysis is the process of evaluating financial data over multiple periods to identify patterns or trends. Common size financial statements can be used to conduct trend analysis by presenting financial statement items as a percentage of a base figure, such as total assets or net sales, for each year. This allows analysts to easily compare the relative changes in financial statement items over time.
4. Financial Ratios: Financial ratios are calculated by dividing one financial statement item by another. Common size financial statements can be used to calculate percentage-based financial ratios, such as the debt-to-equity ratio or the gross profit margin. By using common size financial statements as the base for ratio analysis, analysts can gain a more comprehensive understanding of a company's financial health and performance.
5. Income Statement Analysis: Common size financial statements can be applied to income statements to analyze the relative proportions of revenue, expenses, and profits. By expressing each line item as a percentage of net sales, analysts can identify areas of strength or weakness in a company's income statement and compare it to industry benchmarks.
6. Balance Sheet Analysis: Common size financial statements can also be used to analyze the composition and structure of a company's balance sheet. By expressing assets, liabilities, and equity as percentages of total assets, analysts can gain insights into a company's financial position and its use of leverage or debt.
7. Industry Comparison: Common size financial statements can be used to compare a company's financial performance to industry averages or benchmarks. By expressing financial statement items as percentages, analysts can identify areas where a company may be underperforming or outperforming its industry peers and make informed investment or strategic decisions.
8. Data Interpretation: Common size financial statements provide a clear and concise way to interpret financial data by presenting it in a standardized format. Analysts can easily identify trends, outliers, and relationships by comparing the percentage representation of financial statement items across different years or companies.